

Data Cleaning is the process of transforming raw data into consistent data that can be analyzed. It is aimed at improving the content of statistical statements based on the data as well as their reliability. Data cleaning may profoundly influence the statistical statements based on the data.
R has a set of comprehensive tools that are specifically designed to clean data in an effective and comprehensive manner.

STEP 1: Initial Exploratory Analysis
The first step to the overall data cleaning process involves an initial exploration of the data frame that you have just imported into R. It is very important to understand how you can import data into R and save it as a data frame.
setwd(“C:/Users/NAGRAJ/Desktop/House Pricing“)
dir()
data<-read.csv(“Regression-Analysis-House Pricing.csv“,na.strings = “”)
View(data)
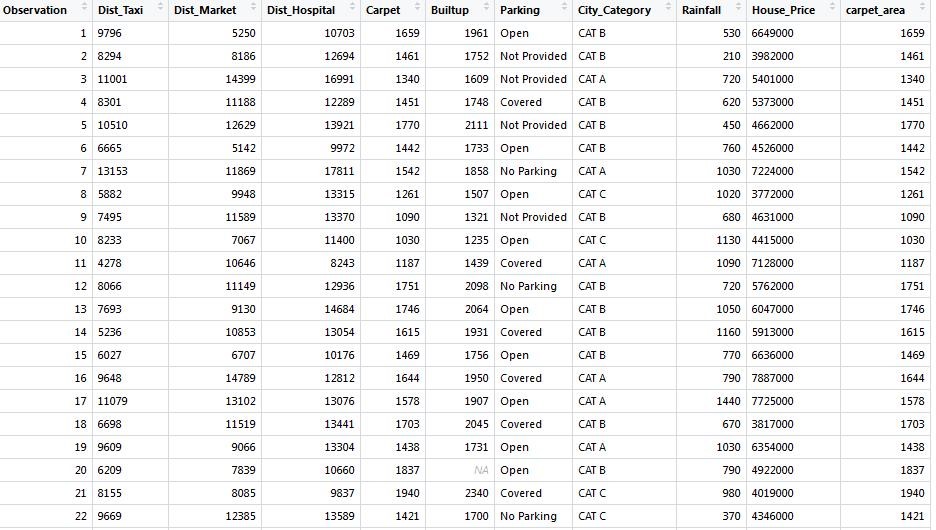
The first thing that you should do is check the class of your data frame:
class(data)
This renders an output as shown below in which we can clearly see that our dataset is saved as a data frame.
[1] “data.frame”
Next, we want to check the number of rows and columns the data frame has.
The code give us & its result:
dim(data)
[1] 932 10
Here we can see that the data frame has 932 rows and 10 columns.
We can view the summary statistics for all the columns of the data frame using the code shown below:
summary(data)
This renders an output as shown below:

STEP 2: Visual Exploratory Analysis
There are 2 types of plots that you should use during your cleaning process –The Histogram and the BoxPlot
- Histogram
The histogram is very useful in visualizing the overall distribution of a numeric column. We can determine if the distribution of data is normal or bi-modal or unimodal or any other kind of distribution of interest. We can also use Histograms to figure out if there are outliers in the particular numerical column under study. In order to plot a histogram for any particular column we need to use the code shown below:
install.packages(“plyr”)
library(plyr)
hist(data$Dist_Taxi)

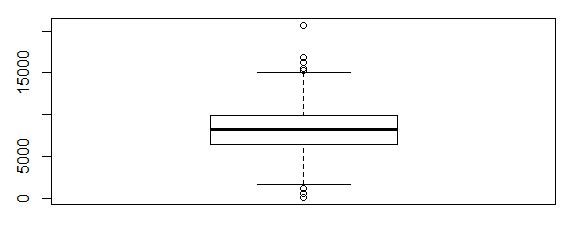
- BoxPlot
Boxplots are super useful because it shows you the median, along with the first, second and third quartiles. BoxPlots are the best way of spotting outliers in your data frame. In order to visualize a box plot we need to use the code shown below:
boxplot(data$Dist_Taxi)
STEP 3: Correcting the errors!
This step focuses on the methods that you can use to correct all the errors that you have seen.
If we want to change the name of our data frame we can do so using the code shown below:
data$carpet_area<-data$Carpet
In the code above we renamed the Carpet column as “Carpet_area”.
Sometimes columns have an incorrect type associated with them. For example, a column containing text elements stored as a numeric column. In such a case we can change the type of column by using the code shown below:
data$Dist_Taxi<-as.character(data$Dist_Taxi)
class(data$Dist_Taxi)
“character”
There are a wide array of type conversions you can carry out in R. They are listed below.
as.character()
as.numeric()
as.integer()
as.logical()
as.factor()
String manipulation in R comes in handy when you are working with datasets that have a lot of text based elements.
In order to change all the text to uppercase or lowercase in a particular column we need to execute the code shown below:
#Making all uppercase
data$Parking<-toupper(data$Parking)
#Making all Lowercase
data$Parking<-toupper(data$Parking)
If we want to trim the whitespaces in the next under a column we need to use the code shown below:
#Installing and loading the required packages
install.packages(“stringr”)
library(stringr)
#Trimming all whitespaces
data$Dist_Taxi<-str_trim(data$Dist_Taxi)
If we want to replace a particular word or letter under a column we can do so using the code below:
#Replacing “Not Provided” with “Not Available”
data$Parking<-str_replace(data$Parking,”Not Provided”,”Not Available”)
In order to replace the outliers with the summary statistics like median the following code is used.
#Replacing the outliers of a particular column with median
vec1<-boxplot.stats(data$Dist_Taxi)$out;
data$Dist_Taxi[data$Dist_Taxi %in% vec1]<-median(data$Dist_Taxi)
The next section will show you how to deal with your missing values:
#Checking for missing values in the entire dataframe
any(is.na(data))
#Checking for the total number of missing values in the entire dataframe
sum(is.na(data))
#Checking for the total number of missing values in a particular column
sum(is.na(data$Dist_Taxi))
#Eliminating missing values completely from the entire dataframe
na.omit(data)
#Eliminating missing values completely from a particular column
na.omit(data$Dist_Taxi)
#Replacing the NA’s in the entire dataframe with ‘0’s
data[is.na(data)]<- 0
#Replacing the NA’s in a particular column with ‘0’s
data$Dist_Taxi[is.na(data$Dist_Taxi)]<-0
#Replacing the NA’s in a particular column with a summary statistics like median
data$Dist_Taxi[is.na(data$Dist_Taxi)]<-median(data$Dist_Taxi)
Suppose we want to unite two columns in our data frame we can do so using the code shown below:
#Installing and loading the required package
install.packages(“tidyr”)
library(tidyr)
data1<-unite(data = data,col = city_category_with_parking,City_Category,Parking)
View(data1)
The unite() function takes 4 arguments – The data frame, the new column name, the first column and the second column name that you want to unite.
Conversely we can also separate a column as shown below:
data2<-separate(data = data1,city_category_with_parking,c(“City_Category”,”Parking”), sep = “-“)
View(data2)
The separate() function takes 4 arguments – The data frame, the column that we want to separate, the names of the new columns and the indicator at which we want the column to be separated at.
steps 1 to 3 above gives you a relatively clean dataset. Always keep exploring new ways that you can clean your data and never stop exploring.
Happy Cleaning!

About Chandana:
Chandana is B.E. She was working as Analyst Intern with Nikhil Guru Consulting Analytics Service LLP (Nikhil Analytics), Bangalore.


very nice and in precise way.Thanks
cant stress enough how useful this is. classic alternative to other cleaning method. thanks a lot Chandana
thanks a lot Chandana. this is the best article on data cleaning in R I have actually read online. keep it up and please write more articles as well on LinkedIn so that we can follow your post.
Its a very informative and precise article.Really loved the content chandana.Keep it up.
Great work Chandana..loved your work
Thanks a ton Chandana. Was working on a project and this came out really useful. Can you please share your coordinates for reaching out. I have a few more doubts regarding same subject.
Thank you so much for this amazing article. I have learnt so much on this. However, I am new to R but very interested in it. How can i become an R expert in dealing with data.(What are the steps i need to take).
Thank you so much. This has been detailed so well that its easy to understand.
Very useful and interesting, I’ll use it in my classes.
thanks a lot!