
The Data Science Workflow Explained
Learn each step of the data science workflow—from problem definition to model deployment. Perfect for beginners and growing data professionals.
Introduction
Data science is not just about coding or building models. It’s a structured process that transforms raw data into actionable business insights. Whether you’re a beginner or an aspiring data scientist, understanding the data science workflow is crucial to working on real-world projects.
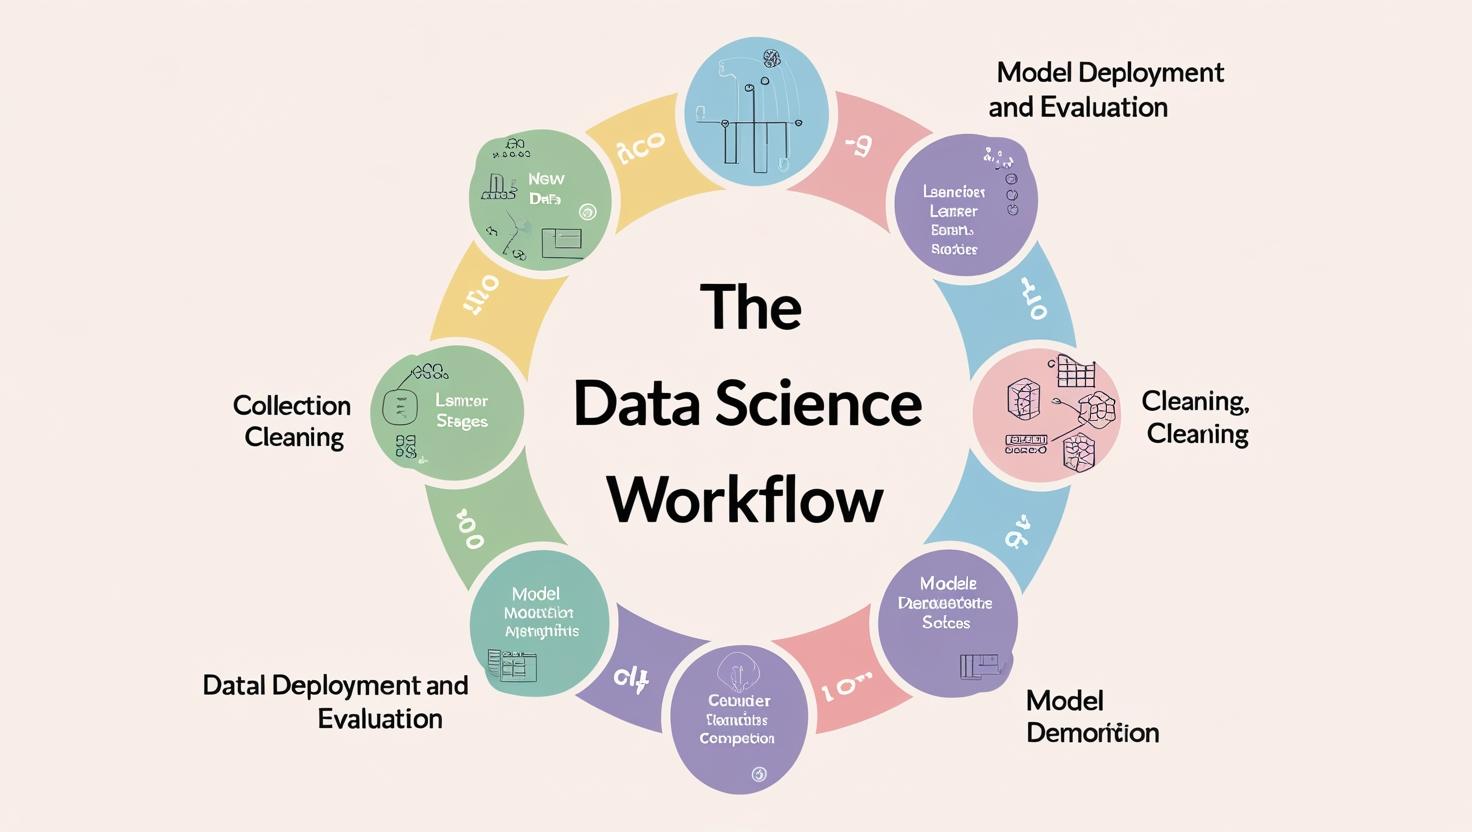
In this article, we’ll break down the 7 key stages of the data science lifecycle and show how each phase contributes to solving business problems effectively.
🔹 1. Problem Definition
Before touching any data, the most important step is understanding what problem you’re solving.
Questions to ask:
- What business question are we answering?
- What does success look like?
- Are we predicting, classifying, or finding patterns?
🔹 2. Data Collection
Once the goal is clear, the next step is to gather relevant data from sources such as:
- Databases (SQL, MongoDB)
- Spreadsheets and files
- APIs or web scraping
- CRM, ERP, or cloud platforms
You may also use synthetic or public datasets to get started.
🔹 3. Data Cleaning and Preparation
Raw data is often incomplete, inconsistent, or messy.
This step involves:
- Handling missing values
- Removing duplicates
- Fixing inconsistent formats
- Feature engineering and transformations
Clean data is the foundation of accurate analysis.
🔹 4. Exploratory Data Analysis (EDA)
EDA is where you visualize and explore your data to understand patterns, outliers, and relationships.
Popular tools:
- Python (Matplotlib, Seaborn)
- Power BI, Tableau
- Excel (Pivot Charts, Slicers)
EDA helps decide which models and techniques to use next.
🔹 5. Model Building
In this stage, we apply machine learning algorithms to make predictions or classifications.
Examples include:
- Regression models
- Classification trees
- Clustering methods
- Time-series forecasting
Model selection depends on the type and quality of data, and the business use case.
🔹 6. Model Evaluation
We test the model using metrics like:
- Accuracy, Precision, Recall
- R-squared, RMSE
- Confusion Matrix or AUC
The goal is to ensure the model performs well on new, unseen data.
🔹 7. Deployment and Monitoring
A great model is useless unless it’s deployed. Deployment means:
- Integrating it into dashboards or applications
- Making predictions accessible to stakeholders
- Monitoring performance over time
Tools used: Flask, Streamlit, Power BI, AWS, Azure
Final Thoughts
The data science workflow is a cyclical, repeatable process. Each project may go through these stages multiple times, refining the model and insights as more data becomes available.
Understanding this workflow helps you move from beginner to professional—step by step.
Learn the Workflow with Real Projects
At Data Analytics Edge by Nikhil Analytics, we guide learners through every step of this process:
- Excel, SQL, Python & Power BI training
- Real-world case studies in BFSI, Retail, Healthcare
- Full project execution and deployment
- Short courses and internship support
Tag:Data, Data Science
You may also like

Must-Read Books for Aspiring Analysts

NLP in Business Practical Applications
